Stats & Facts
Niagara Manufacturing Facts
$2.5 billion
Nominal Manufacturing GDP (2025)
-16%
GDP growth (2022 to 2025)
21,800
Employment (2025)
670
Employer businesses (2025)

26.2 million sq.ft
Total manufacturing area (2025)
$7.27 billion
Export values (2023)
Other Niagara Manufacturing Facts
- Investment in industrial construction (2020 to 2025): $1.13 billion
- Non-employer businesses (2025): 548
- Exporting businesses (2023): 241
- Importing businesses (2023): 323
- Import values (2023): $1.7 billion
- Total manufacturing area (2025): 26.2 million square feet
Niagara’s Top 10 Industries
Manufacturing industries by jobs (2024)
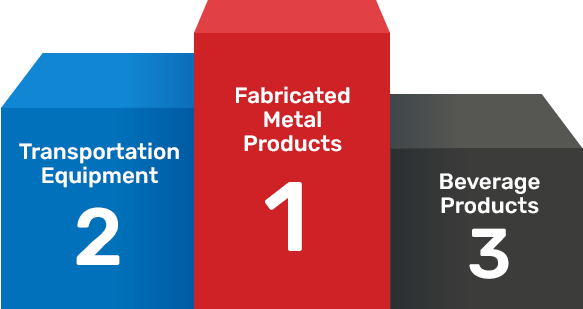
- Fabricated metal products: 2,861
- Transportation equipment: 2,459
- Beverage: 2,350
- Food: 2,050
- Machinery: 1,786
- Primary metal: 1,357
- Chemical: 1,232
- Miscellaneous: 857
- Furniture: 779
- Wood product: 694
Industries by number of employer businesses
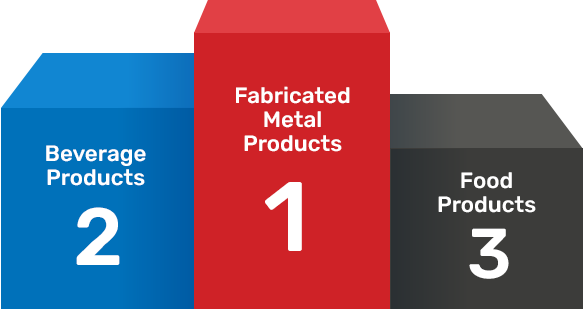
- Fabricated metal products: 108
- Beverage products: 91
- Food products: 76
- Machinery: 67
- Miscellaneous products: 56
- Printing and related support: 38
- Furniture and related products: 35
- Wood products: 33
- Chemical products: 28
- Transportation equipment: 29